
What feeds the view
The view is assembled from records the project is already capturing:
- Activities — names, locations, IDs, critical flags, planned and actual dates
- Weekly Work Plans — which days work was committed to
- Progress logs — the percentage progressed on a given day
- Downtime records — hours lost and the reason
- Issues — with their impact rating (live delay, potential delay, other)
The screen
The view has four regions, top to bottom:
- Controls bar — Show planned dates toggle, Location filter, date range
- Activity details panel (left, scrolls sideways) — one row per activity
- Day grid (right) — one column per calendar day
- Legends — below the grid, the key to every colour and shape on screen
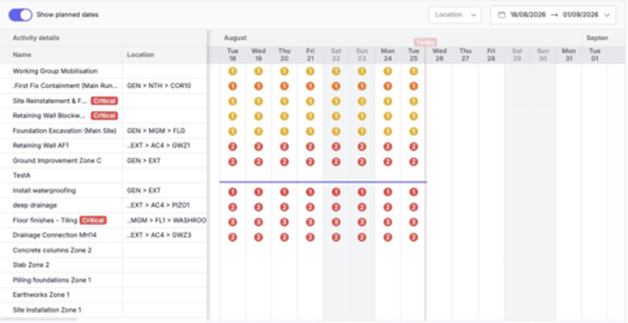
The activity details panel
| Column | What it shows |
|---|---|
| Name | Activity name, with a red Critical badge where the activity is on the critical path. Hovering reveals an arrow that opens the activity itself. |
| Location | The location path, e.g. GEN > MGM > FLG. |
| ID | The activity reference, e.g. A0206. |
| % | Percentage complete, taken from progress logged in the field. Shows - where none has been recorded. |
| Insights | A single status chip per activity (see below). The whole row is tinted to match. |
| Start / Finish | Variance in days against the planned dates — e.g. Start -28d, Finish +7d. Shows – when the required dates aren't there. Coloured using the variance tones in the legend. |
| Planned dates | Planned start and finish dates, at the far right of the panel. These are the baseline the variances are measured against. |
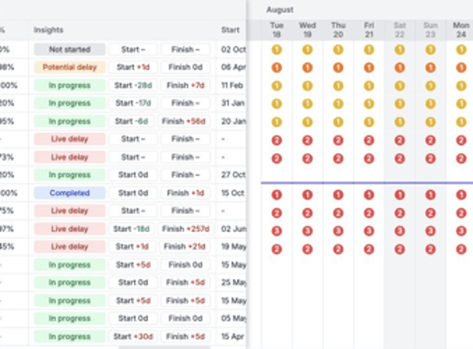
Scrolling the panel sideways reveals the Insights chip and the Start / Finish variances.
Insights chips
| Chip | Meaning |
|---|---|
| Live delay | At least one active issue rated live delay is affecting the activity now. |
| Potential delay | No live delay, but at least one active issue rated potential delay. |
| In progress | Work under way, with no delay-rated issues active. |
| Completed | The activity is finished. |
| Not started | No work recorded yet. |
The chips are ordered by seriousness: a delay-rated issue outranks the underlying status, so an activity that is technically in progress will read Live delay while that issue is open.
The legend
The Legends panel sits below the grid and is the key to every colour and shape in the view. It has four groups.
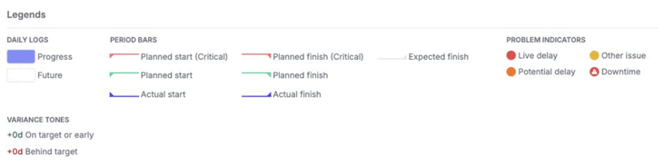 The Legends panel.
Daily logs
| Item | Appearance | Meaning |
|---|---|---|
| Progress | Solid indigo block in the day cell | Progress was logged against that activity on that day. |
| Future | Dashed empty outline | A day that is planned but hasn't arrived yet. |
An empty cell means nothing was planned and nothing was recorded.
Period bars
| Item | Appearance | Meaning |
|---|---|---|
| Planned start / Planned finish | Green line with an end tick | The programme's intent for a standard activity. |
| Planned start (Critical) / Planned finish (Critical) | Red line with an end tick | The same, for an activity on the critical path. |
| Actual start / Actual finish | Indigo line with an end tick | What actually happened. |
| Expected finish | Pale grey line | Where an unfinished activity is currently forecast to land. |
The distance between the planned line and the actual or expected line is the delay.
Problem indicators
| Item | Appearance | Meaning |
|---|---|---|
| Live delay | Red circle with a number | At least one active live-delay issue. The number is how many issues are active on that day. |
| Potential delay | Orange circle with a number | A delay is threatened but not yet being incurred. |
| Other issue | Yellow circle with a number | Active issues with no delay rating. |
| Downtime | Red warning triangle | Hours were lost on that day. |
The number is a count of issues, not a severity score.
Variance tones
Green +0d means on target or early. Red +0d means behind target. These are the tones used on the Start and Finish variance chips in the activity details panel.
The day grid
Each column is one calendar day, grouped under its month, with weekends shaded and Today marked at the top. Anything to the right of Today is planned, not achieved.
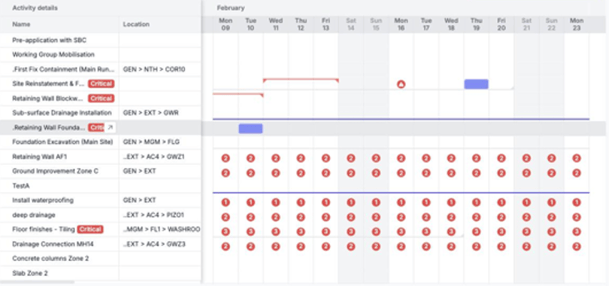
Red critical planned bars, an indigo progress block, and a downtime triangle on the day work stopped.
Hover for the underlying records
Hover any indicator or filled cell to see the records behind it for that activity on that day.
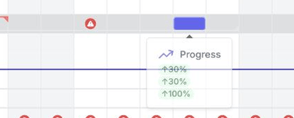
Progress — each increment logged that day.
Downtime — hours lost and the reason recorded.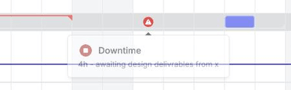
Issues — a count, then each issue's title, status and 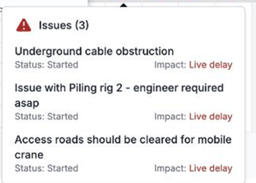 impact, with an arrow through to the issue itself.
The controls
| Control | What it does |
|---|---|
| Show planned dates | On by default. Turn it off to hide the planned period bars and leave only what actually happened. |
| Location | Opens the project's location tree (searchable, multi-select, with Save / Cancel). Filters the view to the areas you choose. |
| Date range | Sets the window. The minimum is two weeks; the picker enforces it and offers Reset / Apply. The view opens on a two-week window by default. |
| Pagination | Sits below the grid, e.g. "Showing 17 of 21 activities", with arrows for the next page. |
Which activities appear
An activity is shown when it has something to report within the selected window — a planned or actual date, a planned working day, or a recorded event (progress, downtime, or an active issue). Activities with nothing in the period drop out, which is why the activity count changes as you move the dates.
Reading a row
- Insights chip — what state is this activity in?
- Start and Finish variance — how far off plan, in days?
- Across the row — which days did work actually happen?
- The indicators — where did it stop, and how long did the problem stay open?
- Hover — what reason was recorded?
- The bars — the gap between the plan and what happened.
Things to note
- The view renders exactly what has been recorded, so gaps in field data show as gaps on screen.
- Variance reads – when a required date is missing.
- An activity can sit at 100% and still read In progress if it hasn't been closed out.
- Very large variances, such as a finish variance in the hundreds of days, usually indicate stale activity data.
- The two-week minimum date range means you can't zoom to a single day.
- Pagination hides rows — check the count below the grid before assuming you are seeing every activity.